Interoperability
Open protocols and formats preserve integration options.
Add Solution uses OpenSearch to build modern observability architectures capable of ingesting, searching, correlating and analysing logs, metrics and traces from applications, infrastructure and distributed environments.
From OpenTelemetry instrumentation to Data Prepper pipelines, cluster architecture, retention, dashboards, APM, alerts and operational analysis, we design OpenSearch environments to turn large telemetry volumes into useful information for investigation and decisions.


An application slows down. A log records a timeout, a metric shows rising latency, a trace reveals the dependency and a service map exposes the relationship. Search crosses these signals to turn isolated evidence into an operational explanation.
Record evidence, errors and state changes.
Show behaviour and trends over time.
Reconstruct the path of a distributed transaction.
Investigates questions no dashboard anticipated.
Connects signals by service, resource and context.
Turns understanding into operational decisions.
Storing telemetry makes data available for querying. Observability begins when we can connect it to explain how the environment behaves.
OpenSearch is an open-source suite under Apache License 2.0 for search, analytics, observability and vector search. Transparency, extensibility, interoperability and deployment flexibility reduce proprietary dependencies, but do not eliminate architectural, capacity, security or operational decisions. The project’s Apache 2.0 licence does not make infrastructure, operations, support or managed services free, nor does it establish universal compatibility.
Open protocols and formats preserve integration options.
Components, data and evolution cycles defined around operations.
Plugins, APIs and pipelines enable combinations tailored to the use case.
The OpenSearch Observability Stack combines OpenTelemetry Collector, Data Prepper, OpenSearch, Prometheus and OpenSearch Dashboards. Traces and logs are processed for OpenSearch; time-series metrics can be sent to Prometheus and queried with PromQL.
Services, containers, cloud and AI agents.
Instrumentation, semantic conventions and OTLP.
Process, enrich, correlate and route.
Searchable logs and traces; time-series metrics.
Search, PPL, PromQL, APM, service maps and alerting.
OpenTelemetry is a CNCF standard, independent of OpenSearch, for generating, collecting and exporting telemetry. SDKs, Collector, OTLP and semantic conventions bring consistency to logs, metrics and traces and reduce unnecessary coupling between applications and platforms.
Applications produce signals with semantic context.
The protocol transports logs, metrics and traces.
Receives, processes, batches and exports telemetry.
Consistent attributes connect resources and services.
Signals are sent to destinations suited to the architecture.
Instrumentation should provide operational context, not unnecessary dependence on a tool.
OpenSearch Data Prepper is a server-side collector and processing engine that receives data, filters, transforms, normalises, enriches, aggregates and routes it to downstream systems. For observability, it prepares logs and traces for indexing, correlation, service maps and analysis.
OTLP, streams and sources suited to the pipeline.
Extract fields from unstructured events.
Standardise names, timestamps and attributes.
Add environment, responsible owner, criticality and resource.
Route signals according to rules and destinations.
Prepare data for efficient search and analysis.
Raw telemetry takes up space. Structured telemetry creates context.
Structured logs support PPL, filters and aggregations; Prometheus metrics show behaviour through PromQL; OpenTelemetry traces connect spans, dependencies, latency and errors. Correlation comes from consistent service identity, trace IDs, resources and context.
Ingestion, parsing, patterns, retention, search and visualisation.
Prometheus, PromQL, time series, and application and infrastructure metrics.
Traces, spans, services, dependencies, errors and latency.
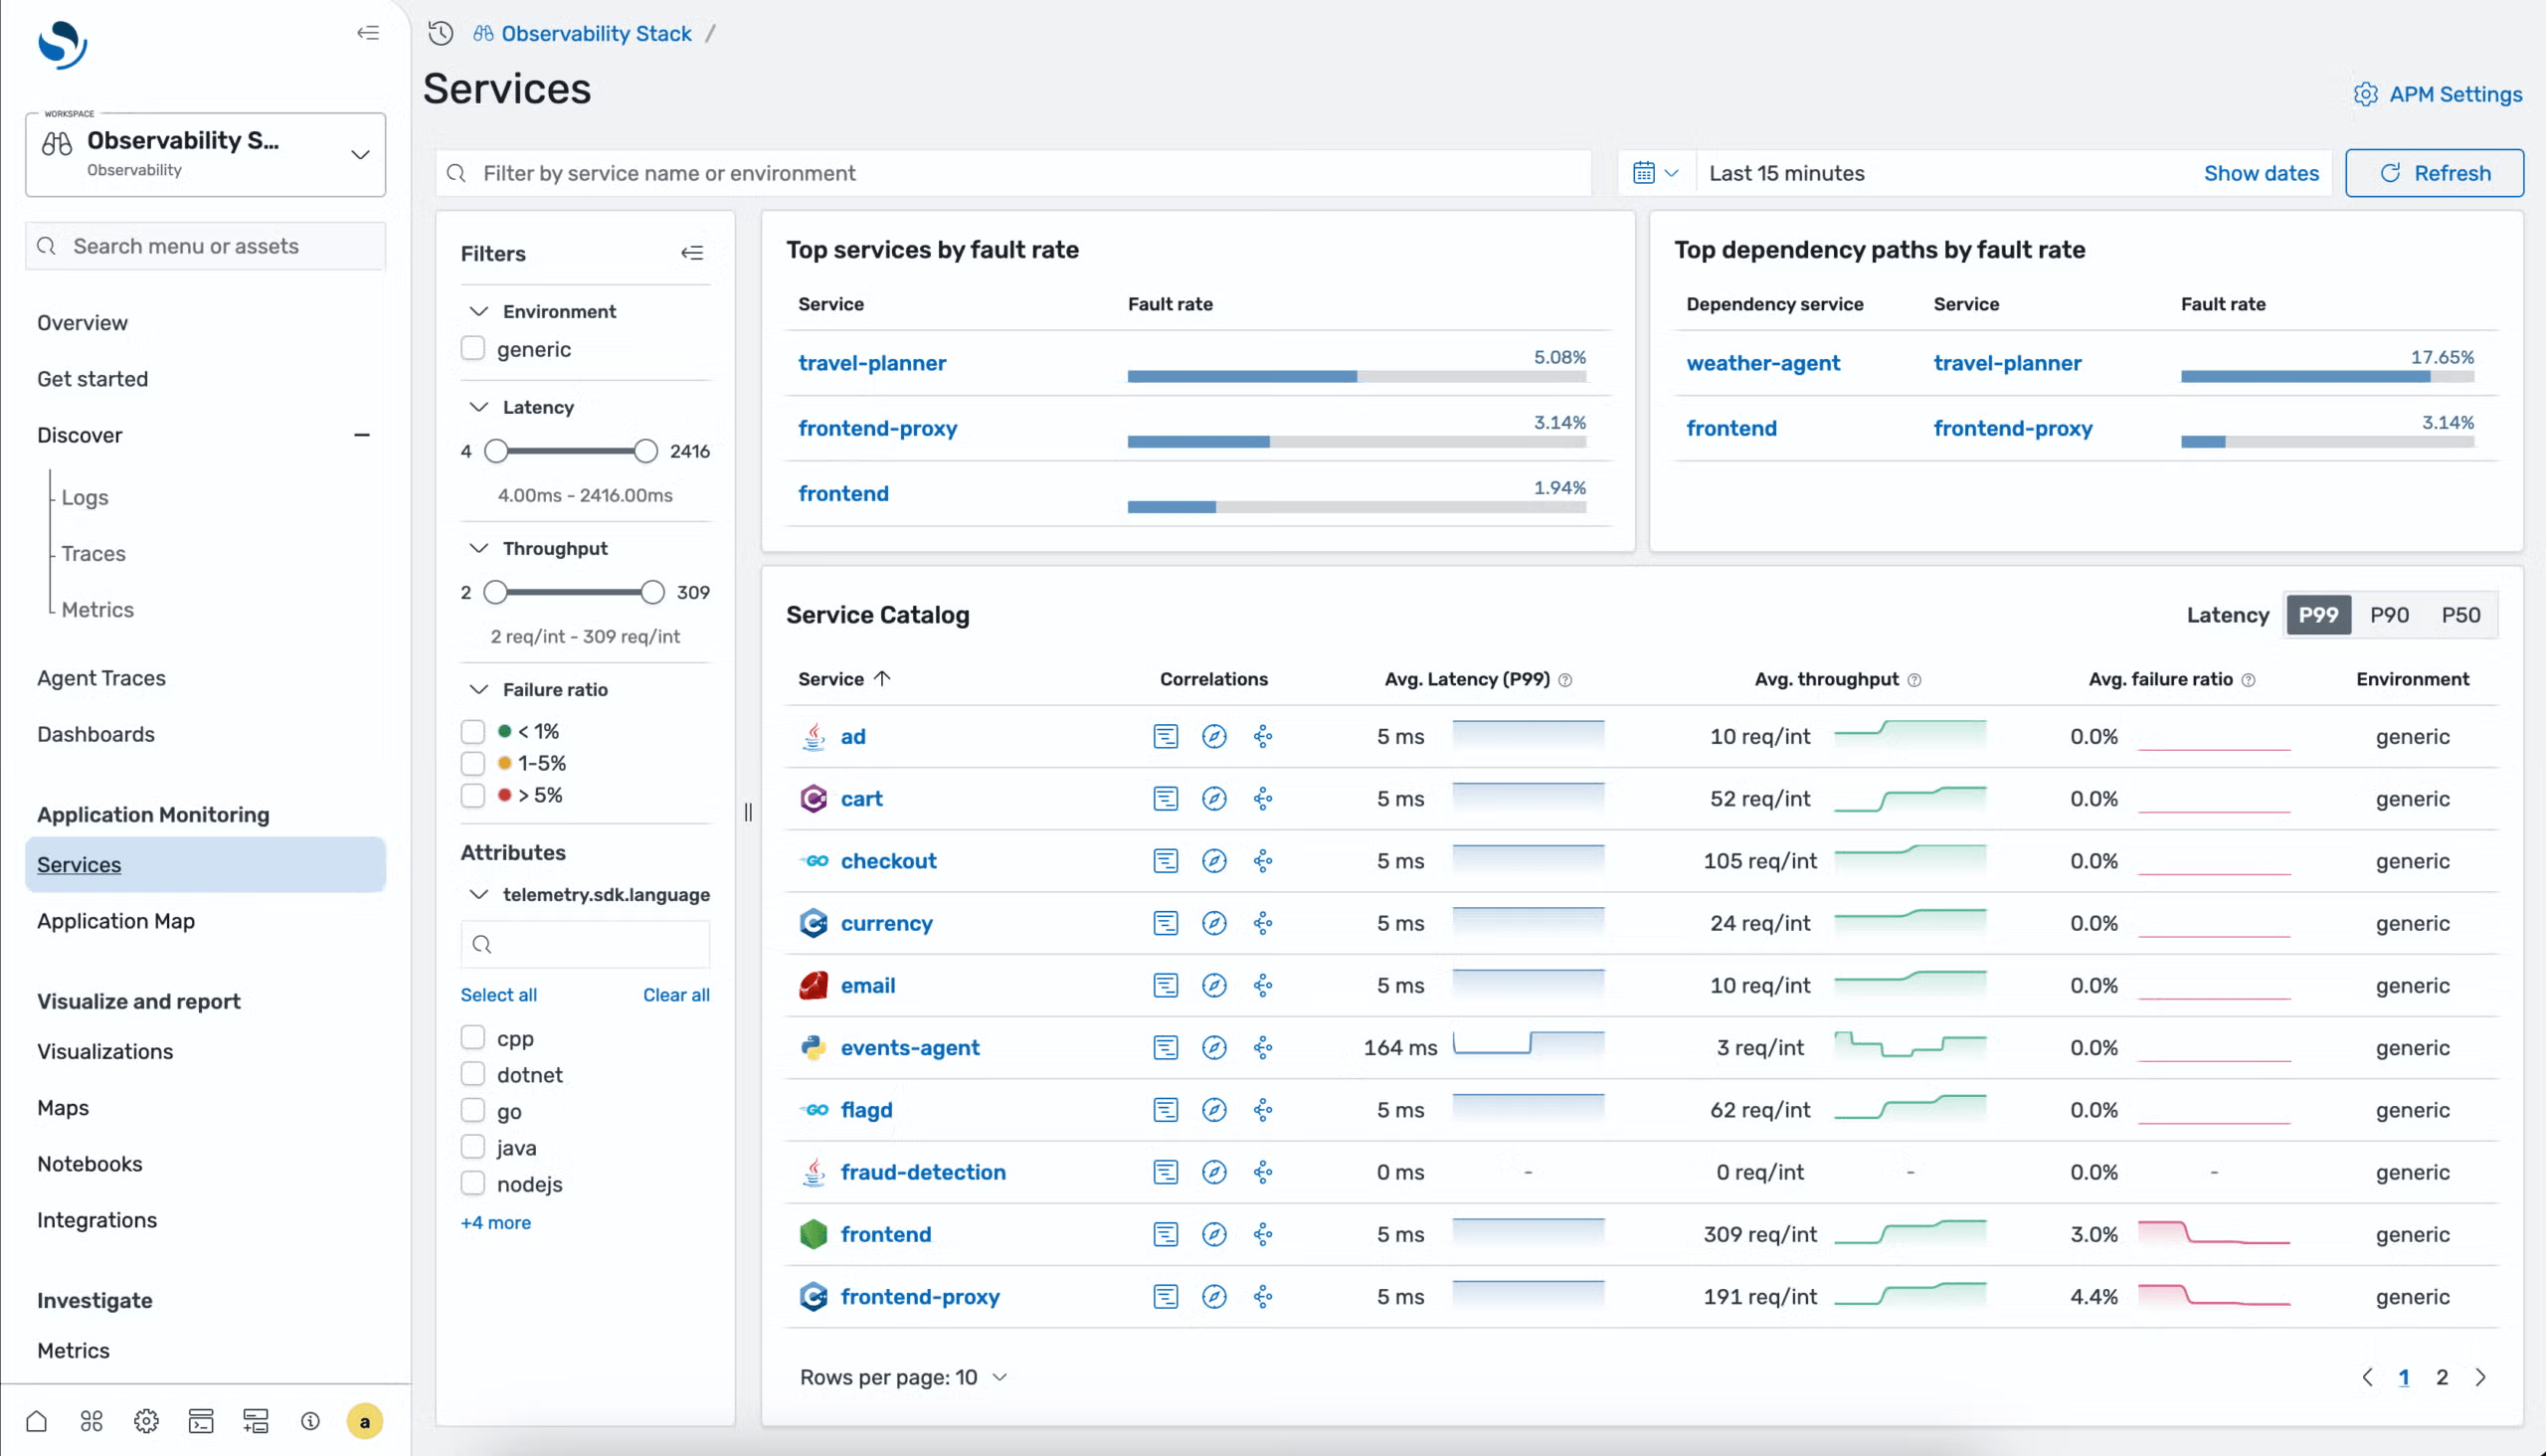
OpenSearch APM combines traces and logs ingested through OpenTelemetry Collector and Data Prepper with metrics in Prometheus. The service catalogue, application map, RED metrics, errors and latency help investigate distributed transactions and dependencies. The documented APM experience was introduced in OpenSearch 3.6 and depends on compatible workspaces, flags and components; it must not be automatically assumed to exist in earlier versions or every AWS offering.
An action starts the observed journey.
The experience entry point and first span.
Calls traverse applications and dependencies.
Latency and errors appear in the transaction context.
Request rate, errors and duration help interpret service behaviour.
Application Analytics organises logs, traces and metrics into a view of the overall system state. Service maps expose relationships; PPL investigates events; PromQL queries metrics; Dashboards brings together visualisation, exploration, management and operational views.
Relationships between services, databases and dependencies, with RED context.
Piped Processing Language supports logs, traces and event analytics.
PPL, SQL, Query DSL and PromQL according to the data and analysis.
A dashboard shows what we have chosen to monitor. Search lets us investigate what we do not yet know.
Full-text search, structured search, filters, aggregations and high-dimensional investigation make it possible to explore new hypotheses. OpenSearch’s strength lies in making large volumes searchable without reducing observability to a fixed collection of dashboards.
A hypothesis emerges during the incident.
Text, fields, time, service and resource define the search scope.
Aggregations and PPL reveal patterns and relationships.
Logs and traces converge through the available context.
The team builds a verifiable explanation.
Anomaly Detection identifies deviations in time series without promising absolute accuracy. Alerting connects the query, condition, monitor, trigger, action and notification. Experimental SLOs can track SLIs, error budgets and consumption rates using a Prometheus-compatible ruler, without confusing an operational SLO with a contractual SLA. Anomaly Detection and Alerting support detection and response, but do not guarantee availability.
Series, events and queries with context.
Deviation and anomaly grade support investigation.
The rule makes it clear when attention is needed.
The monitor and trigger produce an event that can be acted on.
A notification or integration initiates the operational process.
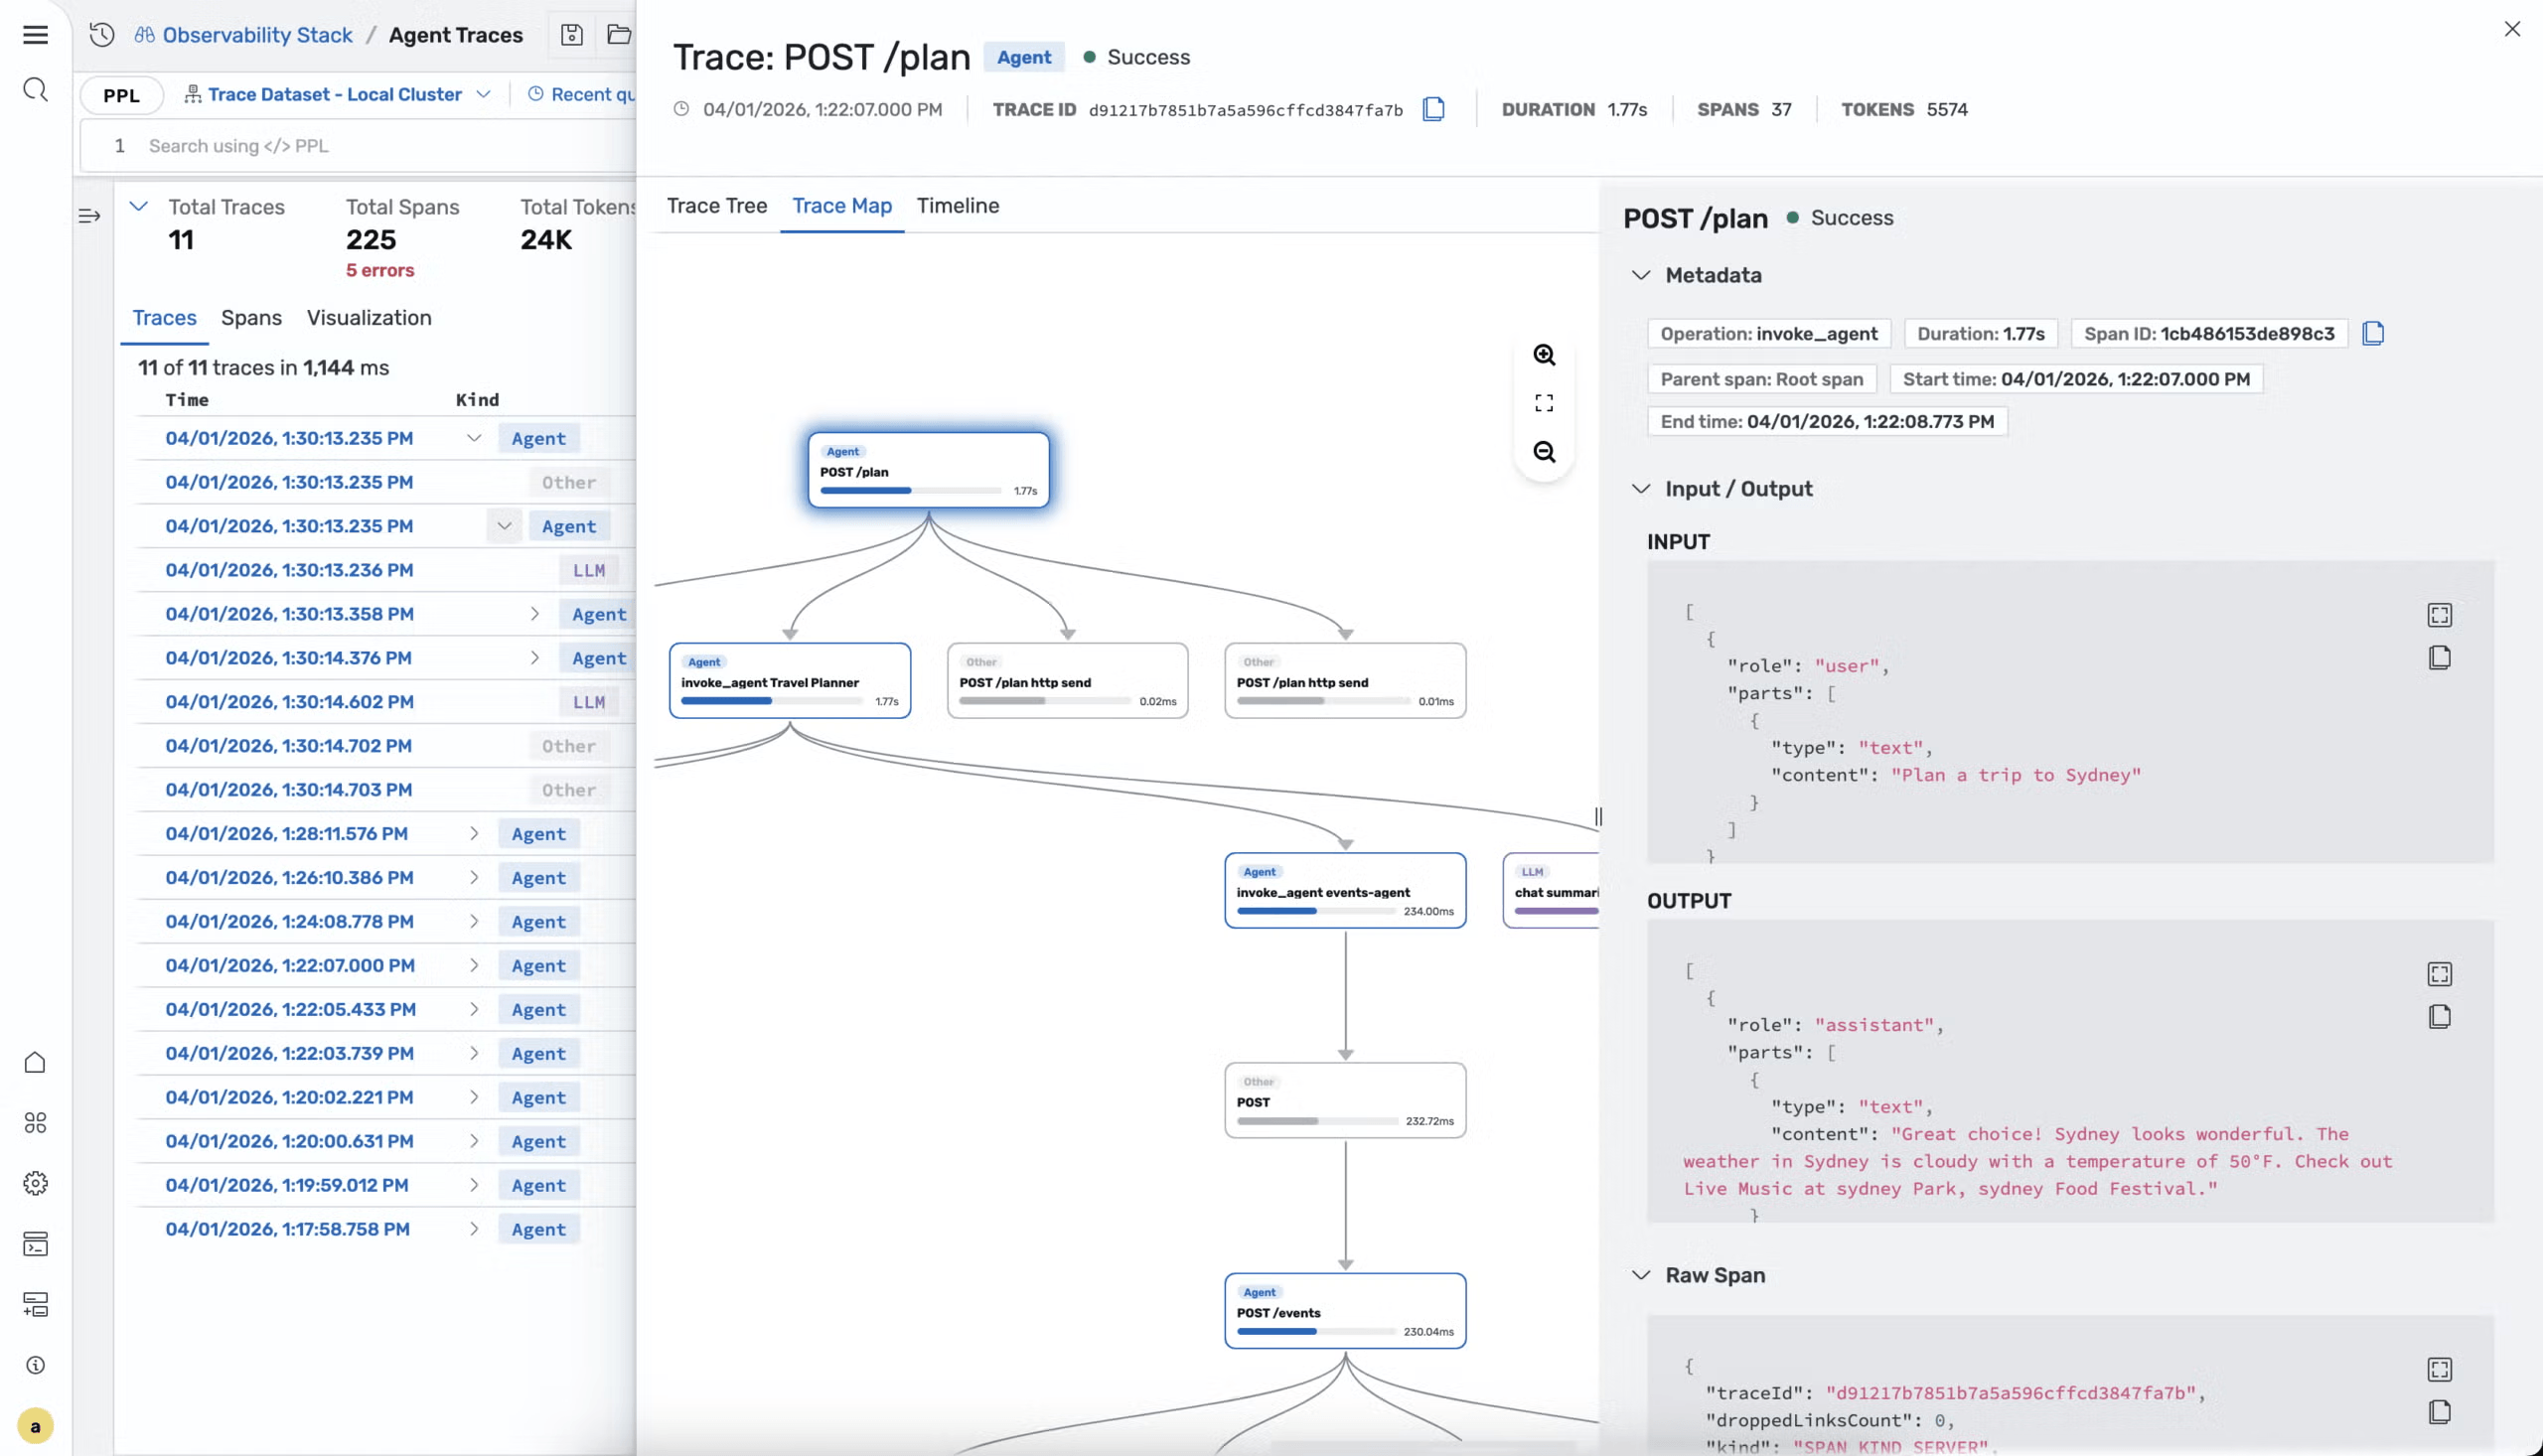
Agent Traces uses OpenTelemetry and GenAI semantic conventions to observe hierarchical executions, LLM calls, tools, tokens, sessions, errors and latency. The interface enables exploration of trees, graphs, timelines and aggregated metrics without treating AI as an isolated black box.
A request starts execution.
Context, session and workflow.
Decisions and execution paths.
Model, tokens, calls, database and APIs.
Observable latency, errors, consumption and quality.
An AI application is still a distributed application. It simply adds new components that also need to be observed.
Large volumes of logs, metrics and traces do not guarantee understanding. Decisions are needed about what to collect and how to instrument, normalise, enrich, correlate, index, retain, search, alert, protect and operate. Add Solution works across this entire chain.
Service names, environments, timestamps, resource attributes, trace IDs and ownership.
Mappings, templates, shards, replicas, aliases, rollover and retention aligned with query patterns.
Compute, memory, storage, networking, replicas, snapshots, backup and growth.
Our work does not end when data reaches OpenSearch. That is where observability engineering begins.
Assessment, strategy, architecture, sizing, instrumentation, ingestion, normalisation, indexing, correlation, visualisation, alerting, operations and evolution form a single journey. The design considers applications, infrastructure, cloud, Kubernetes, volumes, retention, security, compliance and processes. Self-managed OpenSearch, Amazon OpenSearch Service and OpenSearch Serverless differ in APIs, plugins, authentication, capacity, recovery and billing.
Environment, signals, volumes, requirements and gaps.
Cluster, Collector, Data Prepper, Prometheus and Dashboards.
GB/day, events, documents, retention, queries, HA and growth.
OpenTelemetry, OTLP and consistent attributes.
Parsing, filters, enrichment, routing and sampling.
Performance, security, snapshots, alerts and evolution.
Add Solution designs self-managed architectures and evaluates managed offerings where appropriate, distinguishing the OpenSearch project from Amazon OpenSearch Service. There is no universal design: ingestion, search, analytics, observability and vector search workloads have different requirements.
Heap, JVM, indexing, shards, mappings, queries, aggregations, cache and storage.
Node distribution, replicas, failure domains, snapshots and recovery.
Authentication, authorisation, RBAC, TLS, encryption, auditing and granular controls.
Rollover, retention, snapshots and storage mechanisms according to the architecture.
Add Solution can assess architecture, clustering, ingestion, Data Prepper, OpenTelemetry, indices, shards, retention, performance, logs, traces and investigation processes. Migration from Elasticsearch requires validation of the source and destination, clients, mappings, APIs, plugins, snapshots, visual objects, the application, rollback and acceptance criteria; it is not simply a universal endpoint swap.
Add Solution combines observability engineering, search and analytics, OpenTelemetry, data pipelines, platform engineering and business context to turn telemetry into the ability to investigate and act.
Logs, metrics and traces driven by operational questions.
Searchable data and verifiable relationships during incidents.
Cluster, performance, availability, security, storage and retention.
Telemetry connected to what keeps operations running.
Finding data is a search capability. Connecting it to understand an environment’s behaviour is an observability capability.
Answers about OpenSearch deployment options, sizing, licensing, snapshots, APM, migration, security and vector search.
OpenSearch is the software project. Amazon OpenSearch Service is a commercial AWS offering, with provisioned and Serverless options. Features, responsibilities and pricing must be checked for the selected option. AWS reference (https://docs.aws.amazon.com/opensearch-service/latest/developerguide/serverless-comparison.html).
It depends on indexed volume, retention, replicas, growth and the characteristics of fields and queries. An estimate must include operational headroom and be validated through testing; raw incoming volume alone is not enough for sizing. Sizing reference (https://docs.aws.amazon.com/opensearch-service/latest/developerguide/sizing-domains.html).
The project licence does not charge for software use. Infrastructure, managed services, operations and integrations can incur costs. It is important to compare the environment’s total cost using explicit assumptions. Licence (https://opensearch.org/faq/) and AWS pricing (https://aws.amazon.com/opensearch-service/pricing/).
No. Replicas help with availability, but they reproduce data changes. Snapshots and tested restores address recovery needs. The plan must account for failures and deletions, including repository protection. Snapshot reference (https://docs.opensearch.org/latest/tuning-your-cluster/availability-and-recovery/snapshots/snapshot-restore/).
Telemetry must be collected and prepared. APM depends on instrumentation and compatible components, including OpenTelemetry, Data Prepper and, in the currently documented architecture, Prometheus for metrics. Coverage and quality must be verified. APM reference (https://docs.opensearch.org/latest/observing-your-data/apm/index/).
There is no universal compatibility. Versions, clients, plugins, mappings, APIs and snapshots require assessment. Run a pilot with representative queries and writes before defining the cutover. Clients (https://docs.opensearch.org/latest/clients/) and migration assessment (https://docs.opensearch.org/latest/migration-assistant/migration-phases/assessment/).
Technical features support access, protection and audit policies. Their configuration, internal processes, data purposes and operational evidence must be assessed. Using OpenSearch alone does not demonstrate compliance. Security reference (https://docs.opensearch.org/latest/security/).
It can support information retrieval, including vector and hybrid search. The application also needs a model, data preparation, quality evaluation and access controls. Integration costs and restrictions must be considered. Vector search reference (https://docs.opensearch.org/latest/vector-search/).
Talk to our specialists about OpenSearch, OpenTelemetry, Data Prepper, logs, traces, metrics, APM, search, analytics, performance and enterprise observability architectures.