Visualisation and exploration
Dashboards, investigation, correlation, alerting and multiple data sources.
Add Solution uses the Grafana Labs ecosystem to build modern observability architectures that connect metrics, logs, traces, profiles, applications, infrastructure, cloud and digital experience in an integrated operational view.
From instrumentation with OpenTelemetry and Grafana Alloy to the architecture of Prometheus/Mimir, Loki, Tempo and Pyroscope, we design environments that turn telemetry into context for investigation, SRE and decision-making.
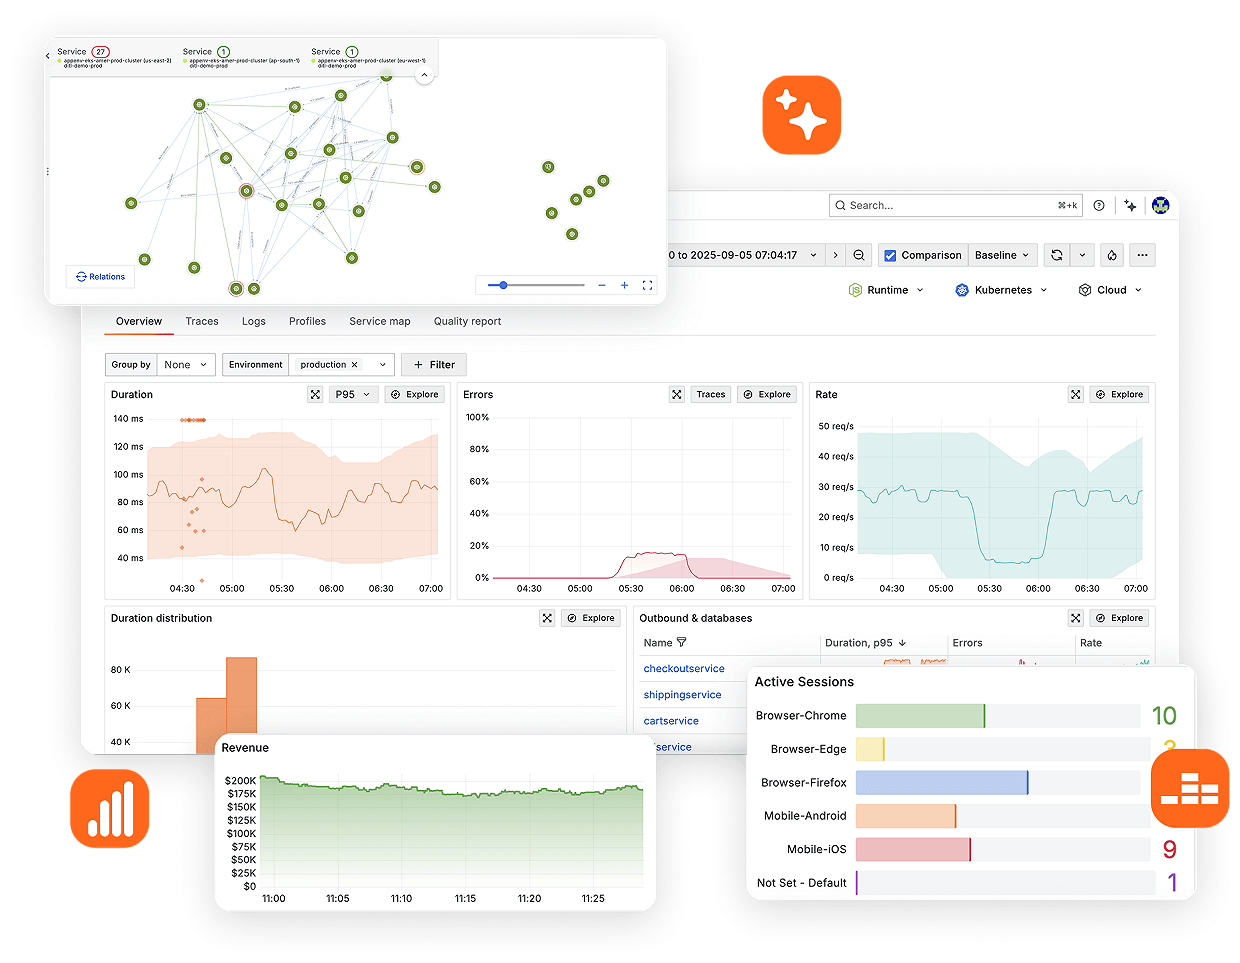
Before a chart exists, decisions are needed about what to observe, how to instrument it, where to collect data, how to transport and normalise it, how much to retain, how to connect signals, what to alert on and which service it represents. Only then does it make sense to decide how to visualise it.
Applications, infrastructure, Kubernetes, cloud, databases and frontend.
OpenTelemetry, Prometheus and libraries suited to the signal.
Receive, process, enrich, filter and route.
Metrics, logs, traces and profiles.
Mimir, Loki, Tempo, Pyroscope or Grafana Cloud.
Grafana correlates, investigates, alerts and supports decisions.
Grafana is where many people see the data. Observability starts long before the dashboard.
Grafana explores and visualises different sources; Mimir scales Prometheus-compatible metrics; Loki aggregates logs; Tempo stores traces; Pyroscope receives profiles; Alloy builds telemetry pipelines. LGTM stands for Loki, Grafana, Tempo and Mimir, while profiling remains an important complementary signal.
Dashboards, investigation, correlation, alerting and multiple data sources.
A Prometheus-compatible, multi-tenant backend designed for long-term retention.
Label-based aggregation, exploration with LogQL and correlation.
Trace backend with object storage, TraceQL and metrics generation.
CPU, memory and other resource profiles correlated with the other signals.
Unified collector for metrics, logs, traces and profiles.
Grafana Alloy is an open source collector maintained by Grafana Labs and a distribution of the OpenTelemetry Collector with Prometheus pipelines and built-in support for Loki, Pyroscope and other backends. For new architectures, it replaces Grafana Agent, which was discontinued in 2025.
Applications, hosts, Kubernetes, cloud, databases and logs.
Scraping, OTLP, exporters and integrations.
Relabeling, filtering, batching and transformation.
Service, environment and ownership metadata.
Mimir, Loki, Tempo, Pyroscope, Grafana Cloud or compatible backends.
Instrumentation should outlast the choice of backend.
Prometheus is a CNCF open source project, fundamental to metrics, scraping, service discovery, exporters and PromQL. Grafana Mimir extends the Prometheus model with horizontal scaling, multi-tenancy and long-term retention. Loki organizes logs by labels and supports exploration with LogQL.
Scraping, exporters, service discovery, rules and remote_write as defined by the architecture.
PromQL compatibility, horizontal scaling, HA and object storage.
Consistent labels, streams, retention and usage-driven query patterns.
Metrics indicate behavior; logs capture operational detail.
Grafana Tempo receives distributed traces via OpenTelemetry and supports queries on relationships, dependencies and paths with TraceQL. Grafana Pyroscope adds continuous profiling to identify where code, libraries and the runtime consume resources.
The experience that initiated the transaction.
Entry point, routing and authentication.
Spans, dependencies, latency and errors.
Queries and waits on the critical path.
Functions and resources consumed during execution.
Metrics show that resource consumption has increased. Traces show where the request went. Profiles help reveal where the code is consuming resources.
Grafana Cloud Application Observability is OpenTelemetry-native and connects services, latency, errors, traces, RED metrics, relationships and profiles. Quality depends on instrumentation, semantic conventions, sampling and consistent metadata. The availability of Application Observability and associated features depends on the deployment model and plan purchased.
Journey and perceived outcome.
Navigation, errors and client-side traces.
Service entry point and contract.
Distributed dependencies and RED metrics.
Database, cache, queues and external services.
Frontend Observability uses RUM, Web Vitals, JavaScript errors, navigation, interactions, browser logs and client-side traces. Synthetic Monitoring runs HTTP, DNS, TCP, ping and browser journeys, including private probes where applicable. SLOs translate availability, latency and errors into operational objectives. Frontend Observability, Synthetic Monitoring, private probes and SLO features depend on the applicable deployment model, plan and configuration.
Grafana Faro/Web SDK and OpenTelemetry connect browser signals to the instrumented backend.
Checks and browser journeys identify failures before users report them.
SLIs, error budgets and burn rates guide reliability and alerting.
Rules, routing, contact points, silences and policies without alerting on everything.
Linux, Windows, VMs, containers, services and network signals can be observed through appropriate integrations and pipelines. Grafana Cloud offers solutions for AWS, Microsoft Azure and Google Cloud, while self-managed architectures can bring together the same signals according to the design.
System, processes, capacity and events.
Ephemeral workloads and dependencies.
Managed services, accounts and regions.
Service traces, metrics and logs.
Signals correlated with operational impact.
Kubernetes Monitoring connects clusters, nodes, namespaces, workloads, pods, containers, events, logs, metrics, traces and resource context. Database Observability monitors PostgreSQL, MySQL and SQL Server according to current support, including metrics, query samples, performance, wait events, schemas and plans.
Alloy and OpenTelemetry track workloads and signals that change with the scheduler.
Metrics and samples help identify which workload is causing degradation.
Requests, limits, usage and efficiency need to be analyzed together.
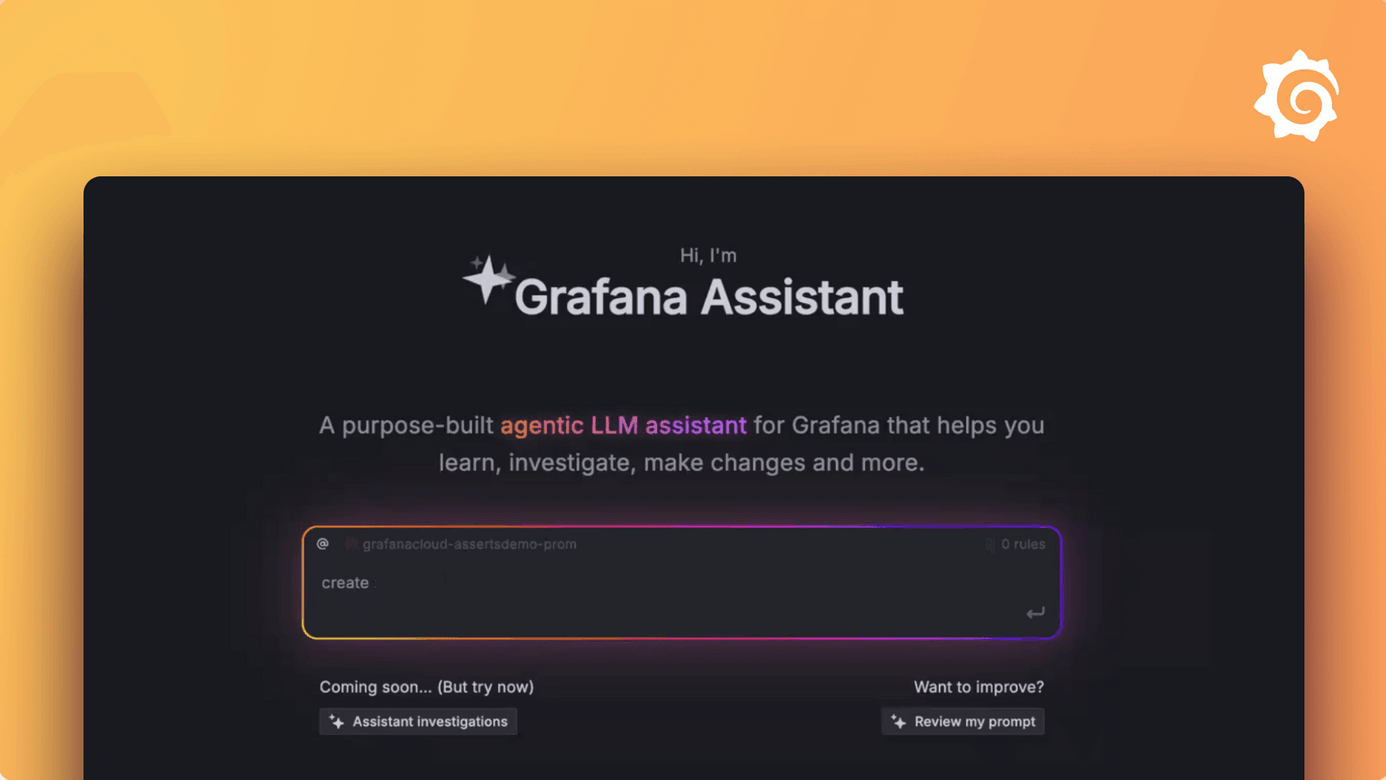
Adaptive Metrics, Logs, Traces and Profiles in Grafana Cloud help analyze the usage and value of signals, reduce low-value volume and preserve investigative capacity. Grafana Assistant uses AI to support troubleshooting, analytics, creation and guidance, keeping the engineer at the center of decision-making. Adaptive Telemetry and Grafana Assistant are features subject to Grafana Cloud's current offering, plan and terms.
Signals with volume, cardinality and cost.
Service, criticality, usage and retention.
Operational question or hypothesis.
Support for investigation and analysis.
Validation, decision and accountability.
Collecting everything is easy. Deciding what is worth keeping requires engineering.
A reliable architecture requires decisions about instrumentation, collectors, labels, cardinality, storage, retention, sampling, queries, alerts, SLOs, correlation, security, high availability, costs and processes. Add Solution starts by asking what the operations team needs to be able to answer.
Service, environment, owner, resource attributes and timestamps underpin correlation.
Labels need to preserve usefulness without compromising cost and performance.
Volume, criticality, errors, latency and investigation guide the strategy.
Operations, SRE, management and executives receive different contexts according to scope.
A dashboard is presentation. Observability is engineering.
We design Grafana Cloud, self-managed stacks or hybrid architectures according to functionality, licensing and requirements. Sizing accounts for active series, cardinality, samples, daily logs, spans, profiles, retention, queries, dashboards, alerts, growth, HA and object storage.
Engineering addresses scraping, exporters, remote_write, recording rules, Loki ingestion and retention, Tempo OTLP and sampling, Pyroscope collection, object storage, HA, load balancing, security, meta-monitoring, configuration as code and GitOps as needed.
PromQL, LogQL, TraceQL, labels, recording rules and usage patterns guide tuning.
Identities, secrets, TLS, receivers and permissions defined for each component.
Grafana Agent to Alloy, OTel, alerts, dashboards, Cloud and backends modernized in stages.
Observe, detect, correlate, investigate, respond and learn through defined processes.
Zabbix adds operational monitoring; Elastic offers search and correlation; Progress Flowmon provides deeper insight into flows and network behavior; Lansweeper adds asset intelligence. Grafana connects multiple sources and signals. These relationships depend on the project and do not represent universal native integration.
Add Solution can assess metrics, logs, traces, OpenTelemetry, Prometheus, Grafana, retention, cardinality, alerts and SLOs to identify gaps and opportunities for improvement.
Add Solution connects observability engineering, open standards, cloud native, SRE, telemetry economics and business context to turn signals into the ability to investigate and act.
Architecture reduces unnecessary coupling between applications and the backend.
Kubernetes, containers, cloud, applications and databases in the same context.
Service-driven SLOs, error budgets, alerting and investigation.
Technical components linked to the services that support the business.
Answers about collection, components, deployment models, cardinality, access, availability and Grafana assessment.
Collection depends on appropriate instrumentation, exporters, agents or integrations. Grafana queries the configured sources. First validate that data is arriving; then confirm that the dashboard queries the right signal. See data sources (https://grafana.com/docs/grafana/latest/datasources/).
The combination depends on your signals and existing systems. You can start with a compatible source and expand as needed. Each additional backend brings capacity and operational responsibilities. Learn about Grafana (https://grafana.com/docs/grafana/latest/introduction/).
They share a foundation but differ in operations and commercial or managed features. Compare the edition and plan in use, especially for plugins, access controls and support. Compare deployment models (https://grafana.com/docs/learning-hub/which-grafana/01-intro/02-the-grafana-landscape/).
The standard facilitates interoperability, but components, attributes, destinations and failure behavior still need to be defined. Configuration depends on the signals and the distribution adopted. Learn about the components (https://opentelemetry.io/docs/collector/components/).
It can generate many combinations when used as a label. In Loki, prefer the appropriate metadata mechanism for high-cardinality fields and assess whether storing that data is necessary. See cardinality (https://grafana.com/docs/loki/latest/get-started/labels/cardinality/).
Do not assume they are equivalent. Dashboard permissions and query authorization are separate controls. Check the edition, source permissions and access granted to the connection. See data source controls (https://grafana.com/docs/grafana/latest/administration/data-source-management/).
These serve different needs. The architecture distributes operations; backups allow state to be recovered after incidents such as improper changes or corruption. Test Grafana restoration and address backends separately. See backups (https://grafana.com/docs/grafana/latest/administration/back-up-grafana/).
Choose a service, two or three operational questions and acceptance criteria. Measure ingestion, queries, coverage and alert delivery over a representative cycle. Use the results to size the expansion and purchasing requirements. See Cloud usage (https://grafana.com/docs/grafana-cloud/platform/pricing-and-usage/).
Talk to our specialists about Grafana, Prometheus, OpenTelemetry, Alloy, Loki, Tempo, Mimir, Pyroscope, applications, Kubernetes, cloud, SLOs and modern observability architectures.