Search and analytics at scale
Searchable telemetry for planned analyses and questions that arise during investigation.
Add Solution uses Elastic Observability to build architectures that can correlate logs, metrics, traces, network telemetry, digital experience and application signals in a unified investigation and analytics platform.
Our work goes beyond data ingestion. We design pipelines, architecture, retention, integration, dashboards, alerts, APM, OpenTelemetry, automation and operational intelligence around the infrastructure, applications and services that support the business.
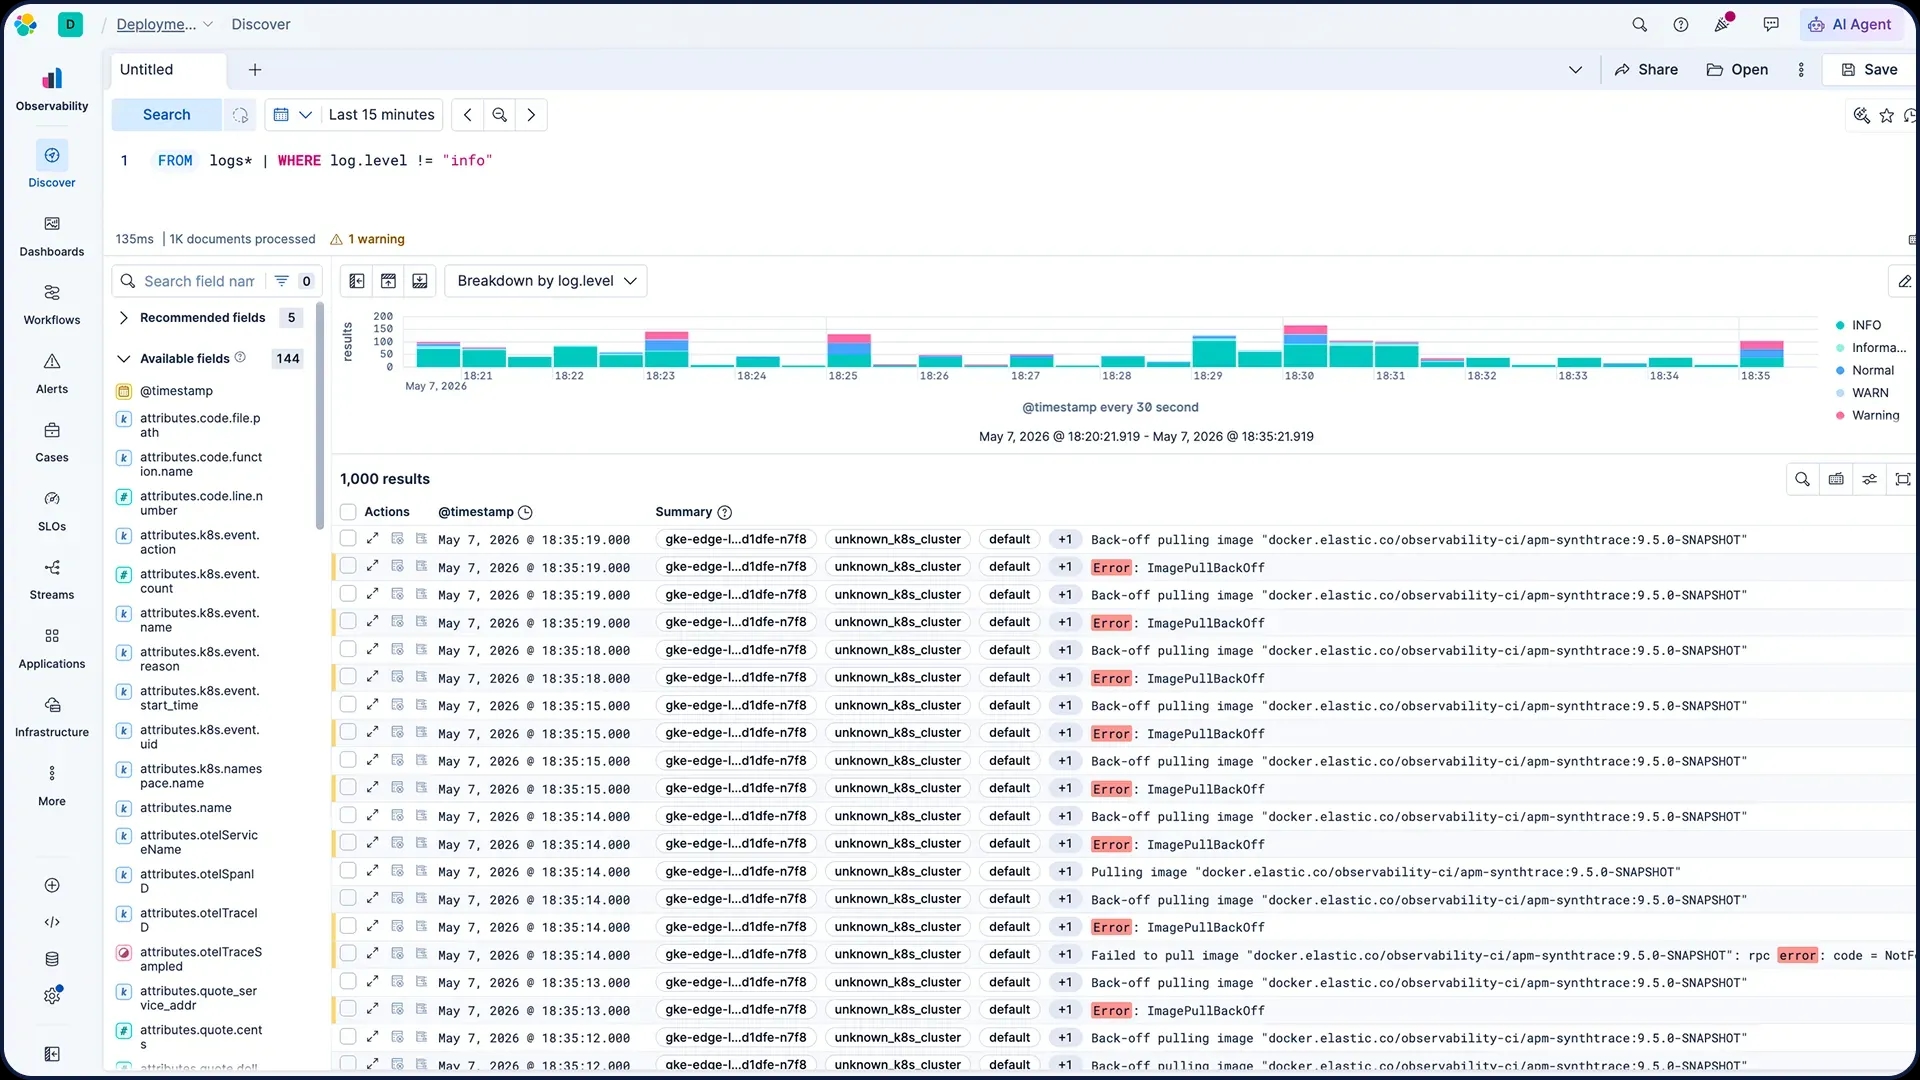

An application slows down. CPU looks normal, the database has no alerts and the network is available, but the user still experiences degradation. The question shifts from “which dashboard is red?” to “what happened across the entire transaction?”.
Describe events, errors and state changes.
Show behavior, capacity and trends.
Track the transaction across services.
Reveal how systems communicate.
RUM and Synthetics show the perceived journey.
Correlation turns signals into investigation and action.
Observability is not about putting all data in one place. It is about being able to navigate that data until you understand what is happening.
Elastic Observability uses Elasticsearch's storage, search, aggregation and correlation capabilities, with Kibana as the exploration and investigation layer. Elastic Agent and Fleet support collection and integration management, coexisting with OpenTelemetry and other sources according to the architecture. The standard distribution of Elasticsearch and Kibana remains under Elastic License 2.0 (ELv2). Since version 8.16, eligible free portions of the source code offer AGPLv3, SSPL 1.0 or ELv2, according to the file and its headers; this does not relicense the entire distribution or all features. Official client libraries identified by Elastic remain under Apache 2.0; the artifact and version must be checked. Elastic Cloud Hosted, Elastic Cloud Serverless and self-managed deployments have different responsibilities, controls and features; availability depends on deployment model, region, version and subscription.
Searchable telemetry for planned analyses and questions that arise during investigation.
Visualizations, Discover, APM, infrastructure, alerts and contextual analysis.
Centrally managed integrations and policies where appropriate.
A language for exploring, transforming and correlating data during investigation.
Elastic supports OpenTelemetry to collect metrics, logs and traces across applications and infrastructure. SDKs and collectors standardize emission and transport; native integrations and Elastic Agent can coexist where they deliver specific value.
Instrumented services and workloads.
Signals with conventions and context.
Processing, routing and export.
Search, correlation and investigation.
Standardizing telemetry reduces dependence on instrumentation. Putting that telemetry in context remains an engineering task.
The architecture addresses collection, parsing, normalization, Elastic Common Schema, enrichment, retention and search. Elastic Streams helps organize, structure and identify relevant events in log streams without replacing rules, quality and human validation.
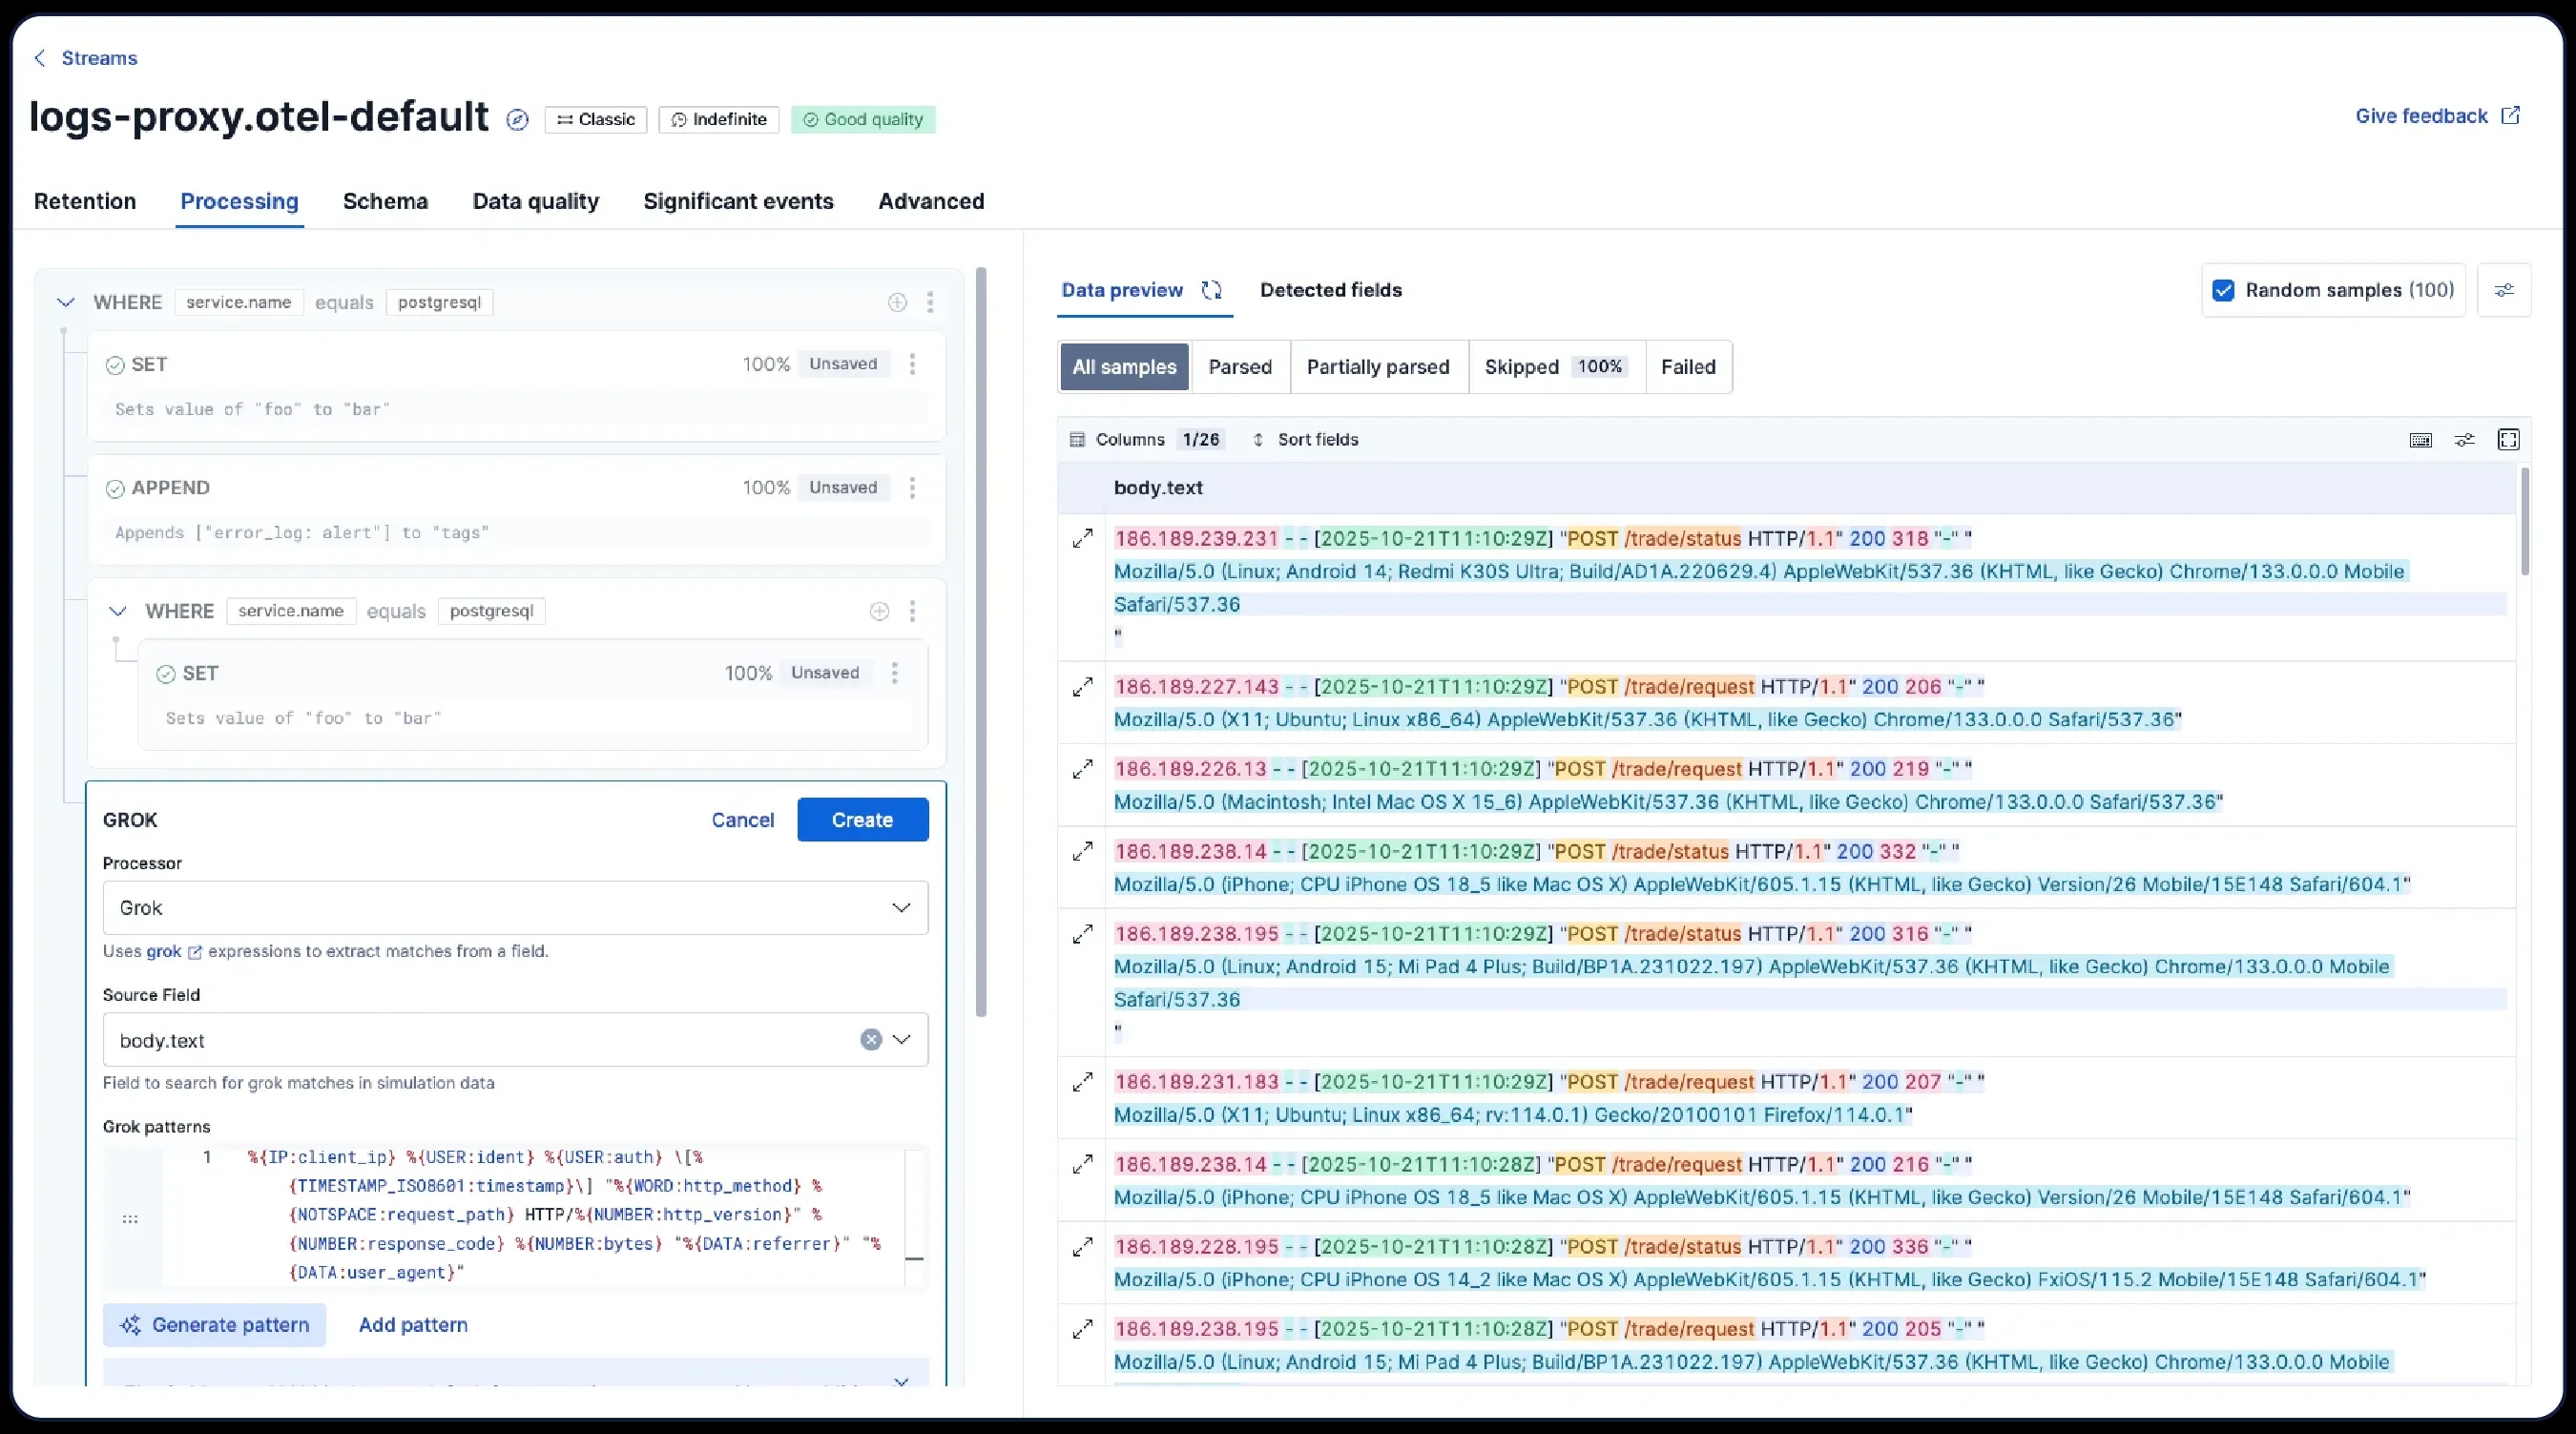
Events received from different sources.
Parsing and consistent fields.
Organization according to context and usage.
Metadados de serviço, ambiente e ownership.
Search, patterns, anomalies and correlation.
Centralizing logs solves the location problem. Observability starts when we can relate those logs to the service we are investigating.
Elastic APM observes transactions, traces, spans, services, dependencies, latency, errors, database calls and external services according to instrumentation. In microservices and cloud-native environments, distributed tracing connects stages that no isolated dashboard can explain.
The experience that initiated the journey.
Entry point, authentication and routing.
Spans, dependencies, timing and errors.
Queries, latency and results.
A dependency outside the application's domain.
The user experiences a transaction. The architecture executes dozens of steps.
Real User Monitoring shows the actual browser experience; Synthetics runs checks and journeys from public or private locations. SLOs connect signals to operational objectives for availability, latency and errors, without confusing them with a contractual SLA.
Browser, device, loading, errors and perceived experience.
Lightweight checks and browser tests for availability and functionality.
SLIs, objectives, error budgets and burn rates translate telemetry into an operational commitment.
Infrastructure, applications, dependencies and experience together define service health.
Hosts, VMs, containers, Kubernetes, cloud and serverless produce metrics and logs that need to be linked to applications. The official NetFlow integration receives NetFlow/IPFIX through Elastic Agent and turns records into searchable documents for analysis of sources, destinations, ports, protocols, bytes and patterns.
NetFlow/IPFIX exporters.
Communication and volume between segments.
Observable sessions and patterns.
Flow records and service telemetry.
Search, analytics and correlation with other signals.
Universal Profiling continuously observes CPU consumption in application code, libraries and the kernel, helping locate expensive functions and efficiency opportunities without requiring instrumentation of every function.
Tracing shows where the request went. Profiling helps explain where the code is consuming resources.
Elastic combines metrics and log integrations with APM/OTLP traces to track requests, latency, usage, cost, errors and providers in LLM and agentic AI applications. Prompts and responses require specific privacy, access and retention policies. Vector search and RAG depend on the corpus, embeddings, filters, evaluation, data authorization and features available in the purchased deployment model.
Intent and request experience.
Code, session, context and guardrails.
Orchestration, decisions and tools.
Model, provider, tokens, latency and cost.
Dependencies, retrieval and results.
An AI application is still a distributed application. It simply adds new dependencies, costs and behaviors to observe.
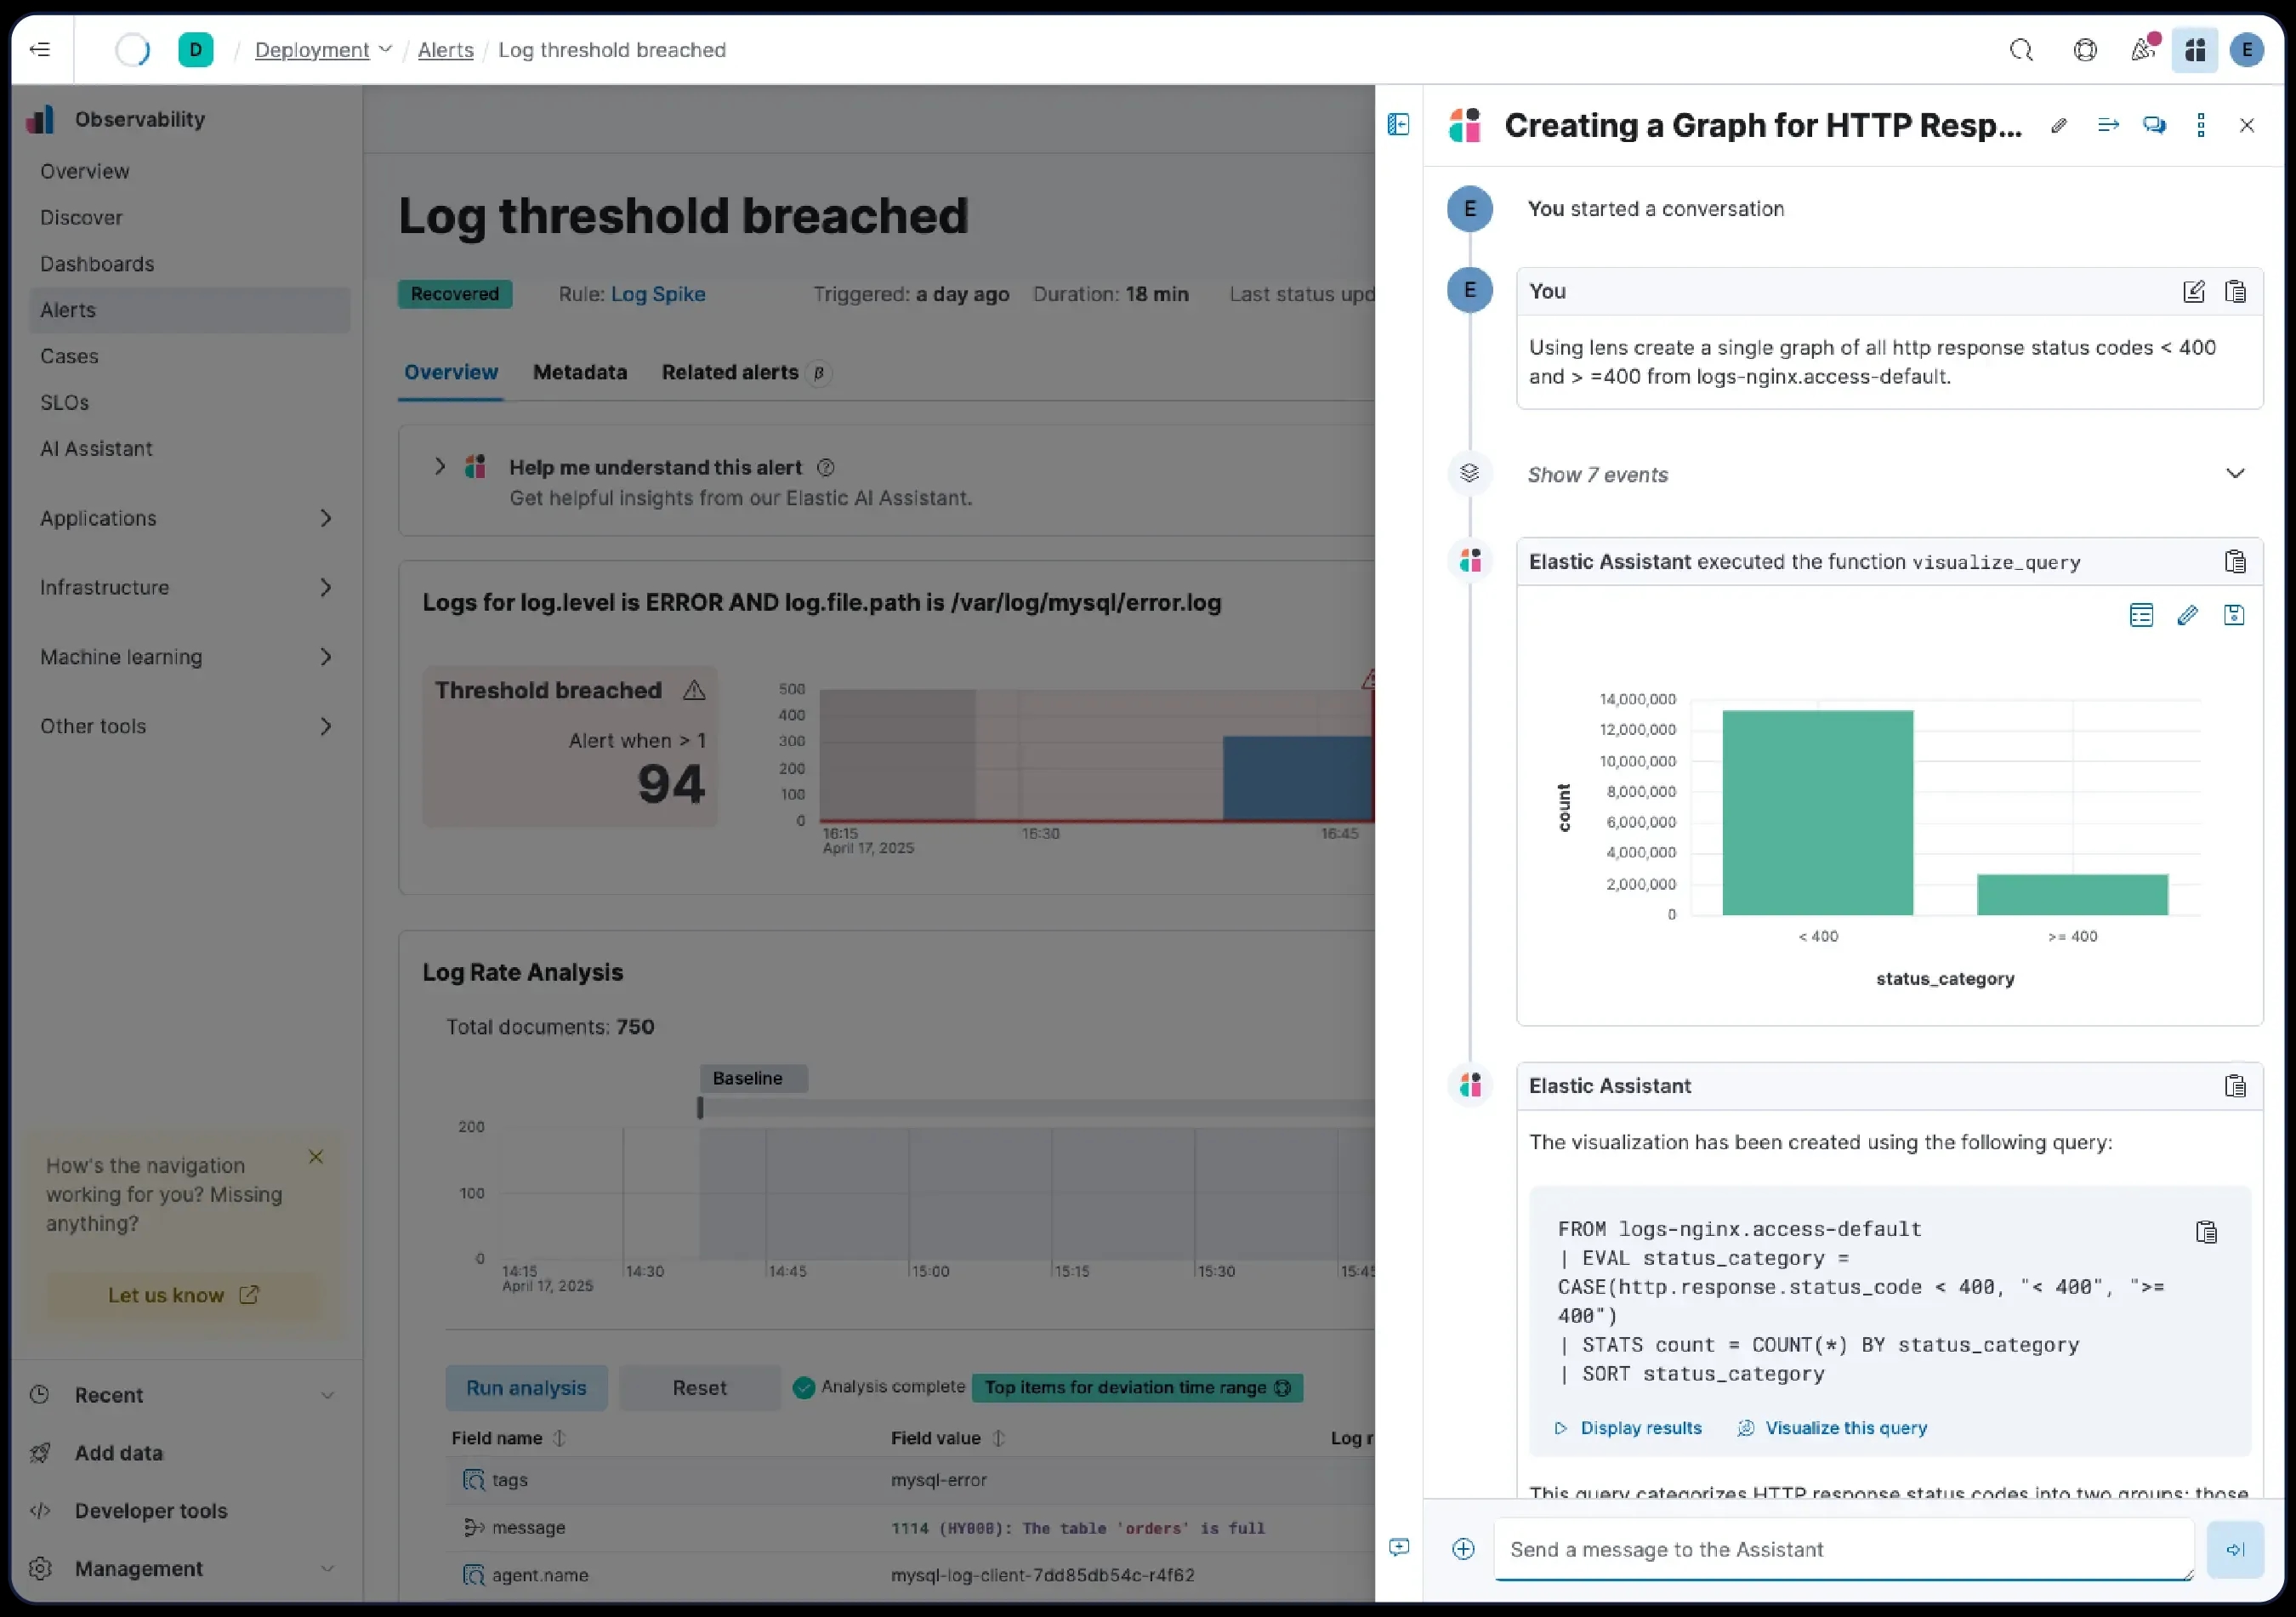
Agent Builder for Observability uses platform context and tools to support investigation of infrastructure, applications and root causes. Workflows executes deterministic automations driven by alerts, events, schedules and search results. Agents can reason; workflows keep actions repeatable and controlled.
Receive signals with context.
Identify a condition, pattern or anomaly.
Add service, owner and criticality.
Cross-reference signals and dependencies.
The operator and AI assess evidence.
The workflow executes a defined, auditable action.
You can store billions of events and still have no answers. Add Solution starts with what the organization needs to understand: services, applications, criticality, users, signals, retention, granularity, teams and decisions that should lead to action.
Fields, names, timestamps, correlation IDs, environments and ownership must be consistent.
Information represents journeys and operations, not just components.
An alert without context merely transfers the investigation to someone else.
Investigation requires exploring hypotheses that were not already built into a dashboard.
Telemetry is raw material. Observability is the ability to turn it into understanding.
We design Elastic Cloud, self-managed or hybrid architectures according to edition, requirements and licensing. Sizing considers daily volume, cardinality, sampling, retention, replicas, tiers, search, concurrency, ML, AI, flows and growth — without universal formulas. Hosted and Serverless are not equivalent: ILM, plugins, node configuration and user-initiated snapshots do not apply in the same way in Serverless.
The architecture balances performance, retention and cost through applicable data streams, lifecycle management and data tiers. It also considers shards, mappings, ingest pipelines, queries, cardinality, sampling, security, high availability and the evolution of legacy environments. Commercial and operational features vary by subscription; replicas do not replace snapshots, and no RPO, RTO or savings are assumed.
The strategy varies according to search speed, historical horizon and acceptable cost.
Elastic Common Schema helps align fields where appropriate to the use case.
Indexing, search, storage and concurrency analyzed as one system.
Upgrades, pipelines, Beats to Agent where applicable, OTel, data streams and dashboards.
Zabbix helps explain infrastructure health; Progress Flowmon provides deeper insight into communication and network behavior; Lansweeper adds asset context; Elastic correlates signals; Business Service Monitoring connects impact to the service. This is a view of possible capabilities, not a mandatory architecture or a claim of native integration.
Add Solution can assess your current architecture for logs, metrics, traces, APM, OpenTelemetry, retention, alerts and correlation to identify gaps and opportunities for improvement.
Add Solution combines observability engineering, application experience, infrastructure, networking, cloud, data engineering, AI, automation and business context to turn a platform into operational capability.
Logs, metrics, traces, experience and flows addressed together.
Instrumentation aligned with the architecture and critical journeys.
Networks, servers, cloud, Kubernetes and dependencies.
Ownership, criticality, operations and experience guide investigation.
Answers about components, telemetry, shards, snapshots, deployment models, licensing and Elastic assessment.
No. Elasticsearch stores, indexes and queries data; Kibana enables exploration and visualization of information and administration of available features. The architecture must consider both components and their dependencies. Reference (https://www.elastic.co/docs/deploy-manage/deploy/elastic-cloud/cloud-hosted).
Yes. A deployment can prioritize log sources and evolve according to operational questions. Metrics and traces require appropriate collection and instrumentation. Define the first stage with measurable quality criteria. Reference (https://www.elastic.co/docs/solutions/observability/apm/get-started).
No. Count and size must balance parallelism, overhead and recovery. The decision must be measured with a representative workload, also considering expected growth. Reference (https://www.elastic.co/docs/deploy-manage/production-guidance/optimize-performance/size-shards).
No. Replicas and snapshots address different problems. Recovery after deletion or disaster requires its own strategy and restoration testing. Reference (https://www.elastic.co/docs/deploy-manage/tools/snapshot-and-restore).
Supported paths exist, but language, version, endpoint, conventions and functionality must be checked. Transport compatibility does not prove that all dashboards and features will behave identically. Reference (https://www.elastic.co/docs/solutions/observability/apm/opentelemetry).
No. Availability varies by feature, license, subscription and deployment. Check the current matrix and the chosen component's terms before finalizing the scope. Reference (https://www.elastic.co/subscriptions).
It transfers infrastructure management and updates to Elastic. The organization still needs to address data quality, access, queries, retention and usage monitoring. Reference (https://www.elastic.co/docs/deploy-manage/deploy/elastic-cloud/serverless).
Gather sources, estimated volume, retention, environments and priority services. The technical discussion enables diagnostics, deployment and operations to be defined according to need. Technical reference: Elasticsearch clusters, nodes and shards (https://www.elastic.co/docs/deploy-manage/distributed-architecture/clusters-nodes-shards).
Talk to our specialists about Elastic Observability, APM, logs, metrics, traces, OpenTelemetry, Synthetics, Network Flows, LLM Observability, AI and automation.