Flowmon Collector
Centralises, organises and analyses flow telemetry to build network visibility.
Add Solution uses Progress Flowmon to turn network telemetry into operational visibility, performance analysis, anomaly detection and incident investigation.
Using flow data, behavioural analysis and intelligent packet capture, we build a view that explains how the network behaves, where degradation occurs and which events need attention.


Availability alone does not explain slowness, unexpected usage, dependencies or behavioural changes. Network telemetry reveals who communicates with whom, when, for how long and in what volume.
Flows and metadata generated by the infrastructure.
Conversations, services, applications and dependencies.
Relevant patterns, deviations and changes.
Evidence-led investigation.
Monitoring status shows whether something is available. Observing flows helps explain what is happening.
The Flowmon architecture combines telemetry collection and generation with modules for visibility, performance, behaviour, security and investigation. The configuration is defined according to the environment and expected outcome.
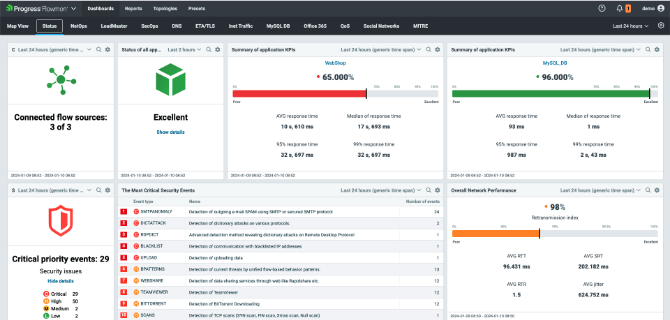
Centralises, organises and analyses flow telemetry to build network visibility.
Generates flow data from traffic when the infrastructure does not provide the required telemetry.
Analyses behaviour and deviations to support threat detection and investigation.
Triggers on-demand or event-driven packet captures and automates PCAP analysis.
Passively observes applications at the network level to support experience and performance analysis.
Flowmon receives telemetry such as NetFlow, IPFIX, sFlow, jFlow and NetStream, as well as data generated by probes and cloud sources. Add Solution defines exporters, observation points, retention and sizing so that visibility reflects the actual environment.
Routers, switches, firewalls, virtual environments and cloud.
NetFlow, IPFIX, sFlow, jFlow, NetStream and equivalent sources.
Collection, analysis, correlation and context.
Performance, capacity, security and investigation.
Flow data provides efficient coverage and retention for observing conversations and trends. When an investigation requires greater depth, packet capture provides detailed evidence. The two approaches complement each other rather than compete.

A continuous view of communication, volume, patterns and trends.
Packet-level detail for events that require precise diagnosis.
Context helps capture what matters at the right time.
Before dashboards, we assess topology, volumes, observation points, asymmetry, encapsulation, retention and operational questions. A platform only produces reliable answers when it receives the right data and is sized to interpret it.
Services, segments, data centres, branches, cloud and critical links.
Exporters, probes, aggregation points and available sources.
A policy aligned with investigation, trends, capacity and cost.
Network, infrastructure, application, security and management teams.
We do not start with the screen. We start with the questions operations need answered.
Flow visibility helps distinguish network, application, usage and capacity problems. Volume trends, top conversations, perceived latency and changing patterns support troubleshooting and planning without turning every analysis into a manual search.
Locate conversations, segments and services associated with the impact.
Compare the current situation with relevant patterns and historical data.
Observe trends, utilisation and growth before saturation.
Flowmon APM uses passive network-level analysis to observe communication between users, applications and databases. This approach complements other observability and tracing practices; it is not intended to replace every form of application instrumentation.
The request arrives over the network.
Communication timing and behaviour.
Response from the observed service.
Dependencies that influence the experience.
Flowmon ADS analyses communication patterns and anomalies to highlight behaviours that warrant investigation. Techniques associated with MITRE ATT&CK help organise the context, while integrations can route events to security processes and platforms.
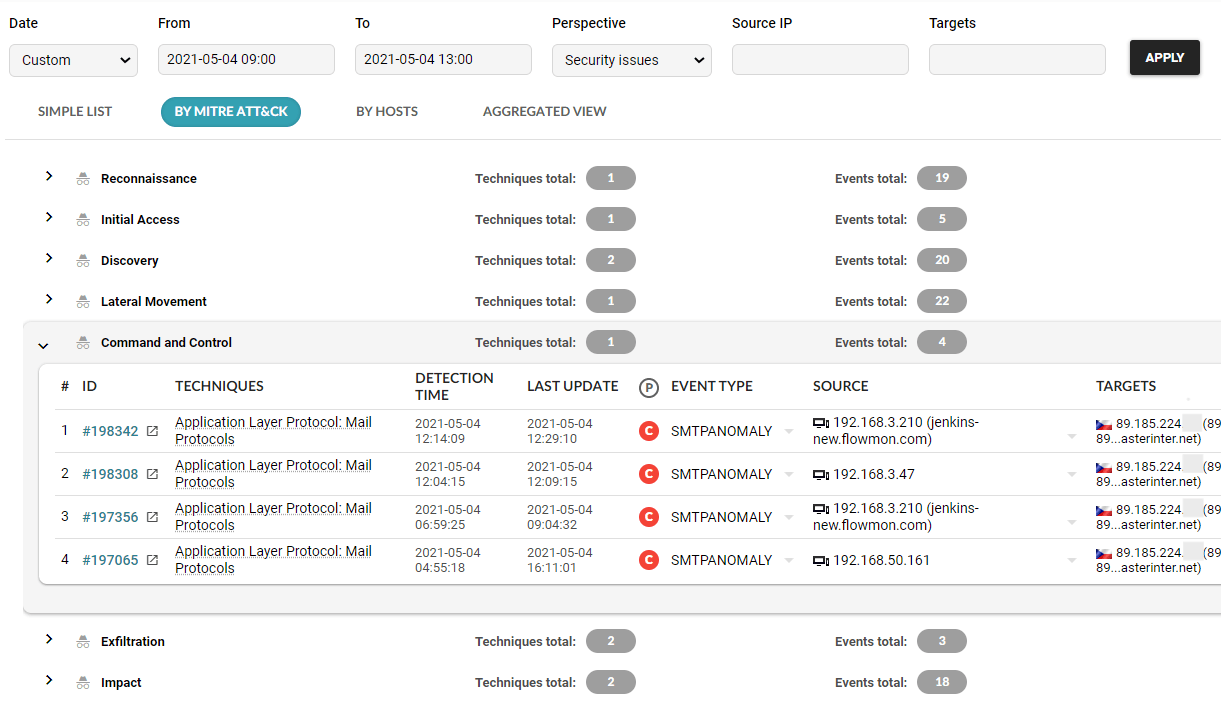
Behavioural changes analysed in the context of the network.
Linking events to techniques to support analysis and prioritisation.
Syslog, SNMP, email, REST and scripts, according to the architecture.
NDR extends network visibility. It does not remove the need for endpoint, identity, perimeter and response controls.
Flowmon Packet Investigator can initiate on-demand or event-driven captures and perform automated analysis of PCAP files. Investigations gain depth without indiscriminate full capture of all traffic.
A behaviour requires analysis.
Relevant packets are collected.
Evidence is preserved for investigation.
Protocols and events are examined.
The team acts with more context.
Events and data can integrate with tools and workflows through syslog, SNMP, email, REST and scripts. In a broader architecture, Fortinet contributes security controls and telemetry, Zabbix provides infrastructure monitoring and Lansweeper adds asset context—relationships designed for each environment, without assuming mandatory integration.
Flows, behaviour, performance and investigation.
Network security controls and context.
Infrastructure availability, metrics and events.
Asset inventory and context.
Data converges to support decisions and response.
Add Solution combines expertise in networking, infrastructure, observability and security to deploy Flowmon around the actual questions operations need answered.
Add Solution can assess telemetry sources, coverage, retention, sizing and use cases to build a visibility strategy aligned with operations.
Our work connects network architecture, data quality, use cases and processes so that the platform is useful in day-to-day operations and at critical moments.
The analysis considers topology, protocols, links, segmentation and dependencies.
Use cases defined before dashboards and alerts.
A multidisciplinary view of events spanning multiple domains.
Architecture aligned with existing workflows, tools and responsibilities.
Clear answers about Flowmon telemetry, modules, retention, recovery and operations.
Not necessarily. Compatible equipment can export flows. A Probe is considered when the data, coverage or attributes required by the use case are missing. Source: architecture (https://docs.progress.com/bundle/progress-flowmon-os-13-0/page/topics/user-guide/Introduction.html).
No. Quality, sampling and attributes matter. ADS does not recommend sFlow for its methods because of data limitations. Source: ADS requirements (https://docs.progress.com/bundle/progress-flowmon-ads-quick-start-guide/page/topics/quick-start-guide/Requirements.html).
No. Flow records are summaries and metadata. PCAP capture requires dedicated resources and a defined storage scope, such as those assessed for Packet Investigator. Source: FPI (https://www.progress.com/flowmon/platform/software-modules/packet-investigator).
No. Visibility depends on the protocol, observation point and technical conditions. Encrypted traffic metadata does not mean unrestricted access to the content. Source: APM conditions (https://docs.progress.com/bundle/progress-flowmon-apm-13-0/page/topics/apm-user-guide/Servers.html).
This should not be assumed. The proposal must confirm modules, models, compatibility and the term of the contracted rights. Source: licence (https://docs.progress.com/bundle/progress-flowmon-os-13-0/page/topics/user-guide/License.html).
It depends on the collected volume and allocated space. Actual retention must be monitored through quotas and validated under a representative load. Source: Resource Manager (https://docs.progress.com/bundle/progress-flowmon-os-13-0/page/topics/user-guide/Resource-Manager.html).
No. The documented mechanism has exclusions, including ADS and APM. Recovery must be planned and tested for each component. Source: disaster recovery backup (https://docs.progress.com/bundle/progress-flowmon-os-13-0/page/topics/user-guide/Backup-for-Disaster-Recovery.html).
The approaches can complement each other. Server and equipment health, communications and security signals answer different questions. The design should define coverage and responsibilities. Source: platform monitoring (https://docs.progress.com/bundle/progress-flowmon-os-13-0/page/topics/user-guide/Recommended-Post-Installation-Steps.html). <!-- FIM_TEXTO_EDITORIAL -->
Talk to our specialists about visibility, performance, NDR, investigation and Progress Flowmon architecture.